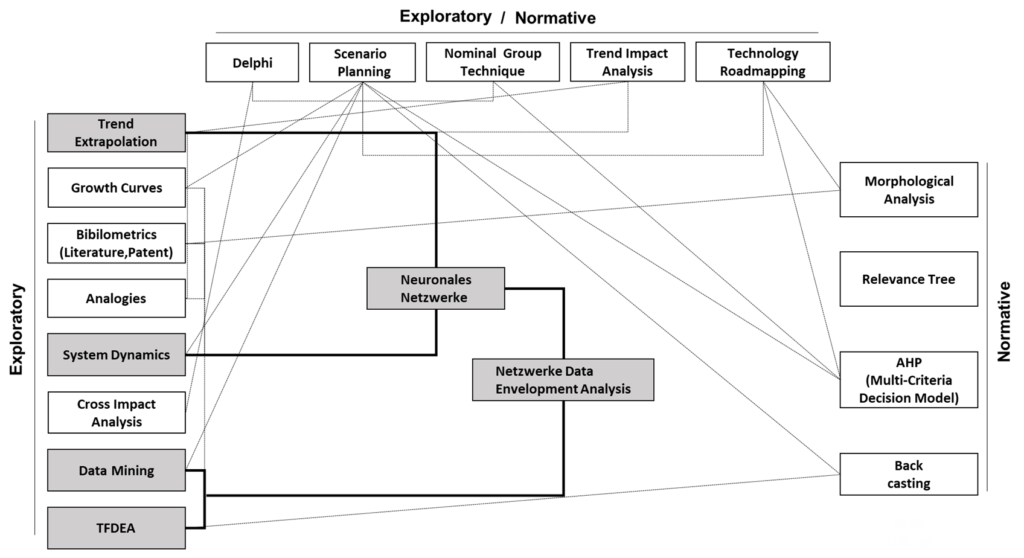
Technology Forecasting using Data Envelopment Analysis (TFDEA)
Forecasting technological developments is of upmost importance for many innovative companies and institutions. It is usually based on the assumption that trends from the (recent) past will continue in future. The availability of large amounts of data in today’s world provides an unprecedented base for forecasts, but also calls for forecasting methods capable of dealing with the increased complexity. The limitation of most traditional technology forecasting techniques of using fixed weights for the parameters in the analysis motivated T.R. Anderson and L. Inman in the early 2000s to develop a new method called TFDEA based on Data Envelopment Analysis (DEA) [1, 2]. TFDEA uses DEA to calculate the efficiencies of different products or technologies available at different points in time. The evolution of efficiencies over time is used to calculate rates of change (ROCs), which is then used to forecast future developments [1, 2].
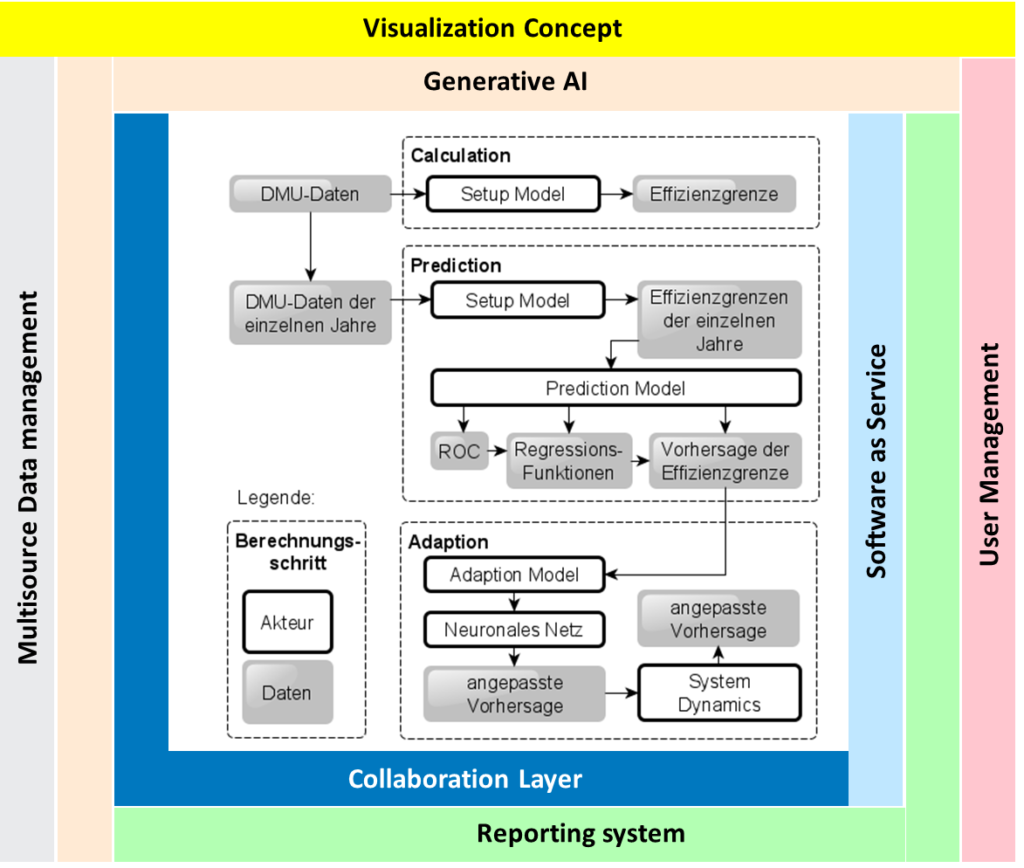
The conventional TFDEA method was extended by K.L. Adjogble replacing the constant ROCs in the conventional TFDEA method by more variable temporal evolution of ROCs [3]: First, regression analysis is used to describe the evolution of ROCs over time using various regression functions. Second, artificial neural networks (ANNs) are used to adapt the regression functions. Finally, System Dynamics is used to include the impact of external effects into the forecast. Having this extended version of TFDEA implemented in CaTI provides manifold possibilities for state-of-the-art technology forecasting.
Data Envelopment Analysis (DEA)
DEA is a method for measuring relative efficiency and was originally developed to compare “decision making units” (DMUs) particularly in the non-profit sector [4]. The efficiency of each DMU is obtained from a comparison with all other DMUs via linear programming, which aims at the minimization of its inputs and/or the maximization of its outputs and allows an individual weighting of inputs and outputs for each DMU to maximize its efficiency. These variable weights (in contrast to fixed, pre-defined weights in many other techniques), the capability to handle multiple input and output variables of arbitrary units of measure are two important characteristics of DEA.
The name DEA originates from the fact that all efficient DMUs (i.e. all DMUs with efficiency value 1.0) form a frontier, which envelops all other, inefficient DMUs. The DEA result doesn’t include only the efficiency values, but also the projection of inefficient DMUs onto the frontier and their so-called reference set, representing the set of efficient DMUs with similar weighting. This facilitate deriving optimization measures or forecasts based on DEA calculations.
Today DEA is a commonly used method in Operational Research, but is also used in many other application areas for the evaluation of various objects (ranging from individual products over companies and non-profit organizations to states). Various DEA models exist, which differ in particular in their optimization direction (input minimization vs. output maximization) and their assumptions concerning returns to scale and substitutability of parameters.
Network DEA (NDEA)
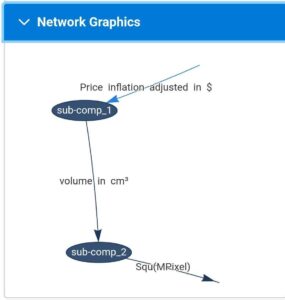
A network DEA describes a technology by establishing a connection between subcomponents. The output of a subcomponent, which can serve as input to the next subcomponent (link), leads to this mentioned network.
NDEA enables you to consider the technology not only as a blackbox. You can define the detailed structure of the technology. Additionally to input and output parameters of the system, links define the inputs and outputs of the sub-systems. The calculation of the DMU efficiency is done using the relative ndea model by chen, cook and zhu (input- and output oriented). The prediction and adaption is executed for the entire system and the sub-systems, so you identify the bottlenecks of your technology.
The difference to DEA is that the structure of the technology is modeled into subcomponents and an additional efficiency analysis and forecast is carried out for each of them. For example, an electric car is a composition of a motor and battery. Input data is required for all defined input and output parameters as well as links.

System Dynamics
TO DO
Artificial Intelligence (AI) and Artificial Neural Networks (ANN)
TO DO.
Model Architecture
Software Architecture
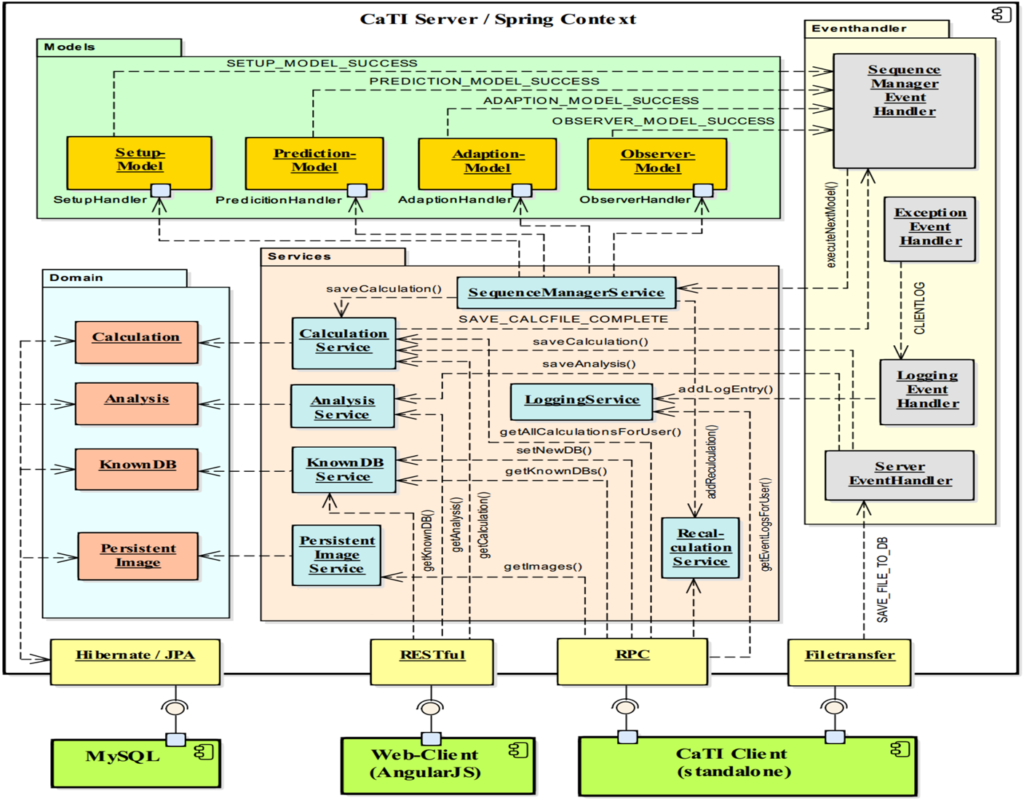
System Layer
References
[1] T.R. Anderson, K. Hollingsworth and L. Inman (2001). „Assessing the rate of change in the enterprise database system market over time using DEA.“ in: PICMET ’01. Portland International Conference on Management of Engineering and Technology, pp. 384-490.
[2] Oliver Lane Inman. „Technology Forecasting Using Data Envelopment Analysis.“ PhD thesis. Portland State University, 2004.
[3] Komi Lolonyo Adjogble. „Technology Intelligence durch Data Envelopment Analysis, neuronale Netzwerke und System Dynamics Methoden.“ German. PhD thesis. FernUniversität Hagen, Mar. 21, 2022
[4] A. Charnes, W.W. Cooper and E. Rhodes (1978). “Measuring the efficiency of decision making units“, European Journal of Operational Research 2(6), pp. 429-444.